

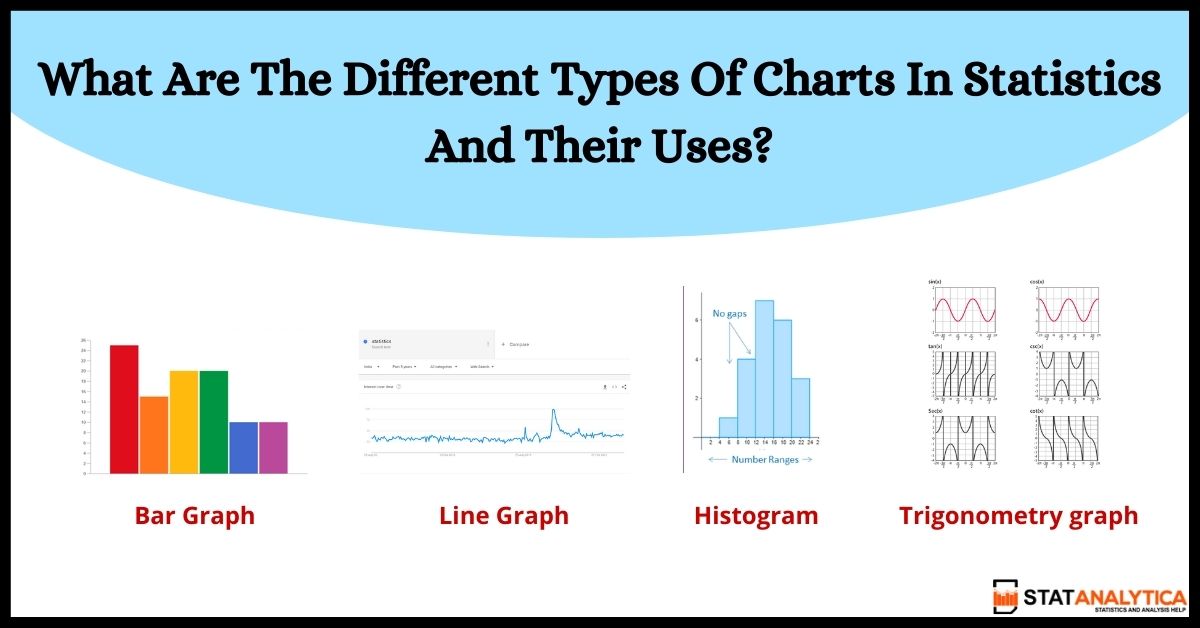
 “Which do you believe is the preferable option if you want to say something?” In statistics, thousands of words or several types of charts in Statistics. An excellent graph or chart can display multiple paragraphs of text. However, how do you choose which graph style to use? Different types of graphs are used to display data in a graphical fashion in mathematics and statistics. We will explore the most common and extensively used forms of charts or graphs in this blog. We are confident that you will gain a better understanding of statistics, as well as where and how to employ different types of charts in statistics.
What are statistics? Statistics is a discipline of mathematics that deals with gathering, analyzing, and presenting numerical data. The study of data from a population in order to properly characterize it, draw inferences, and make well-informed judgments is known as statistics. A population might be a community, an organization, a production line, a service counter, or a natural phenomenon like the weather. Statisticians determine which quantitative model is best for a given circumstance, as well as what types of data should be collected and examined. Applied statistics refers to the application of broad techniques to specific problems. What are the many types of graphs used in Statistics? Bar Graph Because bar charts are one of the most often utilized data representations, they are used by the majority of businesses. They can be used to compare data across categories quickly, highlight disparities, reveal historical highs and lows, and identify patterns and outliers. Bar charts are useful when you have data that can be separated into numerous groups. In statistics, this is one of the most useful types of graphs. Line Charts The line chart, also known as a line graph, connects several data points into a single continuous development. Line charts are commonly used to depict data trends across time (like stock price changes over five years or website page views for the month). As a result, there's a straightforward way to see how one value affects another. Histogram A histogram is a common graphing tool. It's utilized to summarise discrete or continuous data that are measured on an interval scale. A histogram is a graphical depiction of data points divided into user-defined ranges. The histogram, which resembles a bar graph, condenses a data series into an easily accessible visual by grouping several data points into logical ranges or bins. Pie chart A pie chart is a circular representation of a statistical visual that is divided into slices to display all of the relevant data in numerical proportions. In a pie chart, the arc length of each slice (and consequently its central angle and area) is equal to the quantity it represents. Scatter Plot Different colors of dots are used to indicate values for two different numeric variables in a Scatter plot. Each data point's values are represented by the position of each dot on the horizontal and vertical axes. Scatter plots are used to show how several variables are related to one another. Exponential graphs Exponential graphs are the study of exponential functions utilizing a table of values and sketching all of the points on graph paper. It's worth remembering that exponential functions are the inverses of logarithmic functions. The graph of exponential charts can be a rising or lowering shape of a curve, depending on the function. Trigonometric Graphs The sine, cosine, tangent, cotangent, cosec, and sec functions are among the six trigonometric functions shown here. Refer to trigonometry graphs to learn more about each function's graphs, as well as their maximum and lowest values and solved examples. Conclusion I hope you learned some useful information about statistics and the Various Types of charts in statistics. Keep an eye on Statanalytica for more statistics-related content and to gain a deeper understanding of the concepts. At Statanalyica, students can get help with a range of programming languages as well as a variety of assignment services, including Statistics homework help and R programming assignment help.
0 Comments
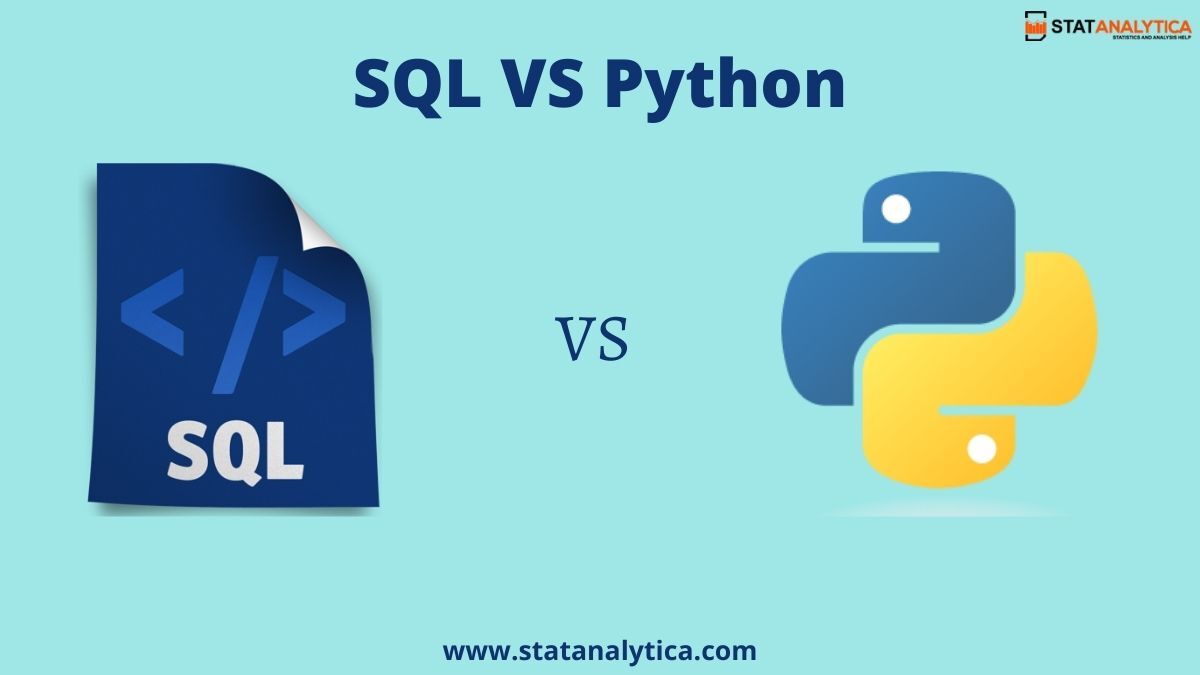 When it comes to Python vs SQL, both languages were created to accomplish different purposes. The primary distinction is that SQL is primarily used to gather, alter, and extract data from databases. On the other hand, Python is a general-purpose programming language that permits data experimentation and is used to create mobile apps, numerous online apps, artificial intelligence, and other applications. So, in this blog, we'll look at both of these languages, how they differ, and how they might be used to improve a programmer's output. So let's start with a brief overview of both languages before moving on to Python vs SQL.
Python is a well-known programming language that can be used to create fantastic apps and websites. Python is a programming language with a lot of capabilities and the capacity to be enhanced. Many programmers consider Python to be more powerful than other programming languages like Java and C++. Python is the best programming language because it can create almost anything with the right tools and libraries. It's an easy-to-learn, elegant, and readable programming language. As a result, it is relatively straightforward to learn. A beginner can readily understand this language. As a result, the programmer feels very at ease working with it. You must first understand the database before proceeding with SQL. A Database Management System (DBMS) is software that saves and retrieves data for users while ensuring security. It's made up of a collection of database-related programs. The DBMS examines a data request from an application. It tells the operating system to send the information. SQL..!! Previously, we stored data on paper, but eventually, we began to save data online in what we referred to as a database. The only term that comes to mind when we talk about databases is SQL. People used to have to keep data in hard copy files back in the day. They're challenging to keep up with. Therefore we need a simple platform to use, manipulate, and update. The advantages of combining SQL and Python. It makes no difference whether you use SQL or Python. Every programming language has its own mix of advantages and disadvantages. To query and extract data, SQL was created. The ability to aggregate data from multiple tables inside a database is one of its most powerful capabilities. SQL cannot do higher-level data manipulations and transformations, such as regression testing and time series. Pandas is a Python-specific library that makes data analysis easier. As a consequence, you can extract data using SQL and subsequently change the structured data using Python. Now that we've looked at how the two languages could complement one other let's look at Python vs SQL. Python vs SQL: What's the Difference? Python and SQL's primary difference is that SQL is a query and retrieval language, whereas Python is a programming language. Python, on the other hand, is largely a data manipulation, experimentation, and processing language. A data analyst should anticipate utilizing SQL the vast majority of the time. On the other hand, Python is widely used for activities other than data wranglings (the process of programmatically converting data into a format that is easier to work with), such as statistics and API work. Is SQL Better Than Python? SQL excels at allowing you to link (or combine) several data sets with ease as a programmer. Python is particularly well suited to structured (tabular) data that can be acquired using SQL but requires additional manipulation that would be difficult to achieve with SQL alone. Conclusion We hope that this blog has provided you some understanding of the differences between Python vs SQL. Both programming languages are necessary for the professional life of a programmer. There are a few fundamental aspects of the blog that you should be aware of it. We can see that SQL is suited for relational databases, with a few restrictions. It may, however, be a valuable tool for beginners.  We'll talk about statistics inference in this section. Statistics is one of the fields of mathematics that deals with data collection, analysis, interpretation, and visualisation of numerical data. Or, to put it another way, it is the collecting of quantitative data that is utilised to provide reliable summaries of data utilising small samples of large populations. In this blog we mention the details of statistics inference. There are two forms of statistical information:
Statistical inference is used to make educated guesses about the population. There are a number of approaches for analysing statistical data and drawing conclusions from it. We will go over the definition of inference, kinds of inference, solutions, and examples of inferential statistics in depth in this post. What exactly do you mean when you say statistical inference? Statistical inference is a strategy for analysing data and drawing inferences from it in order to account for random variations. The confidence interval and hypothesis tests are examples of statistical inference applications. It's used to make random sampling-based decisions on a population's parameters. It can be used to access the relationship between independent and dependent variables. The basic goal of statistical inference is to forecast the sample's uncertainty or variance from sample to sample. This provides a selection of real-value options for the specified population samples. It is dependent on the following three forms, which are required for estimating the values of inferential data:
What is the importance of statistical inference? One can study data more correctly and effectively with the use of statistical inference. To give correct findings that are needed to evaluate the results of research activity, a thorough study of the data is required. These are used to forecast future fluctuations, which are necessary for a variety of observations in many domains. It can create inferences based on a variety of data values. Statistical inference can be applied to a wide range of applications in a variety of domains, including:
What is the technique for inferring statistics? The analysis of inferential statistics entails multiple steps, which are as follows:
Conclusion This blog has covered everything you need to know about statistics inference, which is used to examine data and produce precise results based on supplied observations. This article discusses inferential statistics in depth, including definitions, types, importance, procedures for making inferences, inferential data solutions, and more. All of this will assist you in comprehending inferences and how to utilise the inferential statistics formula to calculate various data kinds.  Data classification is an important part of statistics. It is a method for efficiently organising data. This is quite useful for quickly doing statistics operations on data. The majority of pupils may be unaware of data classification. However, as statisticians, we must assist students in resolving all of their questions. This blog will provide you with the most up-to-date information about classification of data. Let's start at the beginning: -
Introduction to Data ClassificationData classification is the process of organising data into meaningful categories. As a result, the data analyst will find it rather simple to work with. Legal discovery, risk management, and compliance are all aided by data classification. Different rules for data categorization may exist, and they may differ from one organisation to the next. Aside from that, the data can be more effectively protected. Furthermore, when you properly classify your data, you can rapidly search and recover it. It also includes data tagging to make it more searchable and trackable. It also lowers the danger of data duplication. As a result, data storage shrinks, and data backup becomes more affordable. Furthermore, whenever you wish to do any operation on the data, the process will be completed quickly. It might be quite difficult and technical in some circumstances. Data Classification's Purposes
Why do we need data classification? Data classification has been fascinating since the dawn of time. However, it is improving over time. Technology, as we all know, is present in almost every aspect of our lives nowadays. And all of these technologies are employed in the data storage process. As a result, these technologies require it for quick access and consistent compliance. Apart from that, data analysts use it on a regular basis. They used it to look for and retrieve information. Data security is the best element of data classification. It protects data by limiting what may be retrieved, transmitted, and copied. Some of the advantages of data classification are as follows:- The integrity of data It enables you to determine the data's integrity. To put it another way, the data is merged with other organised data, and users must have permission to access it. It took place in a well-planned manner. Confidentiality With data classification, you may create a system that allows users to access only the information they need. It can only happen if the data is properly classified. In this approach, only a small number of people have access to the most critical information. For example, the administrator of a system has access to all data, while users only have access to the data provided by the administrator. Encryption is the most prevalent technology utilised in this system. Availability of data The data can then be made available to a large number of people with appropriate security and simplicity of access. There is no need to look for specific data in order to execute statistical methods. Users can simply search for data due to well-organized data. Conclusion It should now be evident to you what data classification is, how it works, and how important it is. When you're ready, do it the next time. Then you can utilise it with confidence. If you're still having trouble grasping the concept of data classification.  For many years and in various ways, the field of statistics has had an impact on people's lives. It starts with daily activities and extends to the businesses that keep the world's largest cities running, and statistics are used everywhere. As a result, this blog will present you with all of the relevant aspects of statistical analysis, including where it is employed and much more. So, before we go into the intricacies, let's first define statistics analysis.
What exactly is a statistical analysis? It is a process of gathering data, studying it, and then expressing a vast amount of data in order to evaluate trends and patterns in the data. Statistics are used in everyday life by corporations, research organisations, and governments. It's also used to conduct scientific research and then determine the outcomes of that research. Take a look at some of the examples:
Where may the statistical analysis be computed? There are several conventional methods for statistics analysis, which range from data sampling through data interpretation, and have been utilised by academics and scientists for hundreds of years. However, today's data volumes make statistics even more powerful and useful. Computing power, better algorithms, and low-cost storage have all contributed to an increase in the use of computational statistics data. Statistics computations are becoming increasingly vital for statisticians when working with a large range of data quantities or many permutations of measurements. There are a variety of statistical calculation methods available, including: Matrix programming Statistical methodologies and exploratory data analysis are implemented utilising powerful computer technologies using matrix programming for row operation algorithms. Econometrics With the use of effective techniques and tactical plannings, sample, forecast, and improve business processes. These methods use statistics and economics to forecast future trends. Statistic quality enhancement In all parts of productivity, a quantitative technique is employed to examine the quality and safest qualities. Statistical programming Statistical coding is vital for making data-based judgments in each field with the help of classic analysis of linear regression and variance to exact approaches and statistical visualisation methods. Operation Research Analyzing the behaviours that produce the best results might be based on a variety of outcomes and possibilities. To manage the issues and optimise the business processes, simulation, scheduling, and sampling are all used. Statistical visualization To evaluate and develop models of a wide range of data, the rapid and interactive statistical analysis and exploratory skills for visual interface are used. Make futuristic predictions based on the study of past behaviors It can be used in manufacturing, sports, retailing, banking, or any other industry where forecasting the future might benefit the company. Testing the hypotheses of an experiment Observational data simply provides you with the overall tale of the analyses. The “Hypotheses Testing” section of the statistics analysis is where null hypotheses are either rejected or proven. When the results of statistical analysis are misleading Statistical analysis, which employs technological methods to summarise and display the "facts and figures" of a wide range of data, may appear to be rocket science. This entails deliberate manipulations of the outcomes as well as unintentional manipulations. However, statistical analysis can be incorrect at times, as evidenced by the well-known example of "Simpson's Paradox," which is used to represent the best statistics that are entirely useless for studies. In Simpson's analysis, average admissions data from the University of Berkeley appear to imply that women were admitted at a higher rate than men, although this is not the case. As a result, you can see that the statistical analysis is a complete fabrication, and they are unable to accurately portray the study's findings. Conclusion Statistics analysis is utilised in a variety of fields in science, ranging from physics to social science. Statistics can also be used to evaluate hypotheses by providing an approximate value for an unknown figure that is impossible to quantify. For example, statistical analysis can focus on the least likely option in social science issues such as the study of choice or consciousness, which are impossible to compute.  For every student, mathematics is one of the most important topics. Math, too, plays an important role in our daily lives. However, because of its difficulty, most of us despite learning arithmetic. However, math is widely employed in numerous subjects at some of the world's most prestigious colleges. Math, like machine learning and artificial intelligence, is useful in some of the most cutting-edge technology. A shopkeeper to businesspeople, on the other hand, uses math on a daily basis. The majority of pupils have no trouble learning fundamental math, but many struggle with advanced math. We'll show you how to learn math from the beginning to the end of this article.
The Best Ways to Learn Math Examine Errors It is insufficient to simply practise solving math problems. Because every time we try solving a math problem, we run across certain problems. You should practise tackling each problem using a variety of ways. With this, if you make a mistake when solving the task, you should go over your mistakes and figure out where you went wrong. If you do so, you may gain confidence in your ability to do these arithmetic problems without making any mistakes in the future. Master the Fundamentals The majority of pupils attempt to memorise the processes. We all know that math is not a topic that should be memorised. You have the ability to memorise math formulas. However, memorising the complete math problem-solving method is not the greatest option. You should try to learn these principles rather than memorise them. As I previously stated, the more you practise, the better you will be at mastering the important ideas. You will be able to solve problems that are related to the essential concepts if you master them. To comprehend the notions, you must, by the way, be rational. Practice, Practice & More Practice A man's ability to answer problems perfectly is honed through practise. The majority of students believe that by simply paying attention in class, they can answer the math issue. What are your thoughts? Is it possible to solve arithmetic problems solely by listening and reading? Obviously not, because math is unlike any other topic. You come across an issue in math and must solve it using mathematical formulas. Recognize and Address Your Doubts It is self-evident that everytime we attempt to answer a math problem, we become stuck. And, sometimes, the issues take longer to resolve than typical. In this scenario, rather than solving the problems, we aim to avoid them. In this instance, we must comprehend the issues and attempt to dispel our uncertainties. It could take a long time. Math, on the other hand, necessitates a lot of time and patience on the part of the students. You can go through the problem step by step, answering all of your questions along the way. This method is quite successful if you like group study. Because your buddies may be able to clarify your doubts and assist you in solving the situation quickly. Make a Studying Environment That Isn't Distracting The more quiet the environment in which you learn arithmetic, the better you will be able to concentrate on it. Math, as we all know, demands more concentration than any other subject. As a result, it necessitates an appropriate study atmosphere as well as a distraction-free zone. It would assist you in solving the most difficult mathematical equations or difficulties. While tackling arithmetic problems, you can also listen to classical music. Because classical music helps pupils assimilate knowledge more effectively in their minds, it produces a soothing environment. You can play your favourite music or songs in addition to classical music. It will give you more energy and help you think more clearly. Make a Dictionary of Mathematical Terms Isn't it awkward to use a math dictionary? Perhaps not, because math uses a variety of terminologies. As a result, math has its own dictionary with a large vocabulary. It's difficult to remember all of these terms at once. So, how can you get a firm grasp of math vocabulary? Creating a mathematical dictionary is the most effective way to memorise these terms. You can jot down all of the arithmetic concepts, terminology, and definitions, as well as appropriate examples, in this dictionary. Conclusion You've now seen the most effective methods for learning math. There are also some additional methods for teaching you how to learn arithmetic from the beginning to the end. This method, however, is better suitable for beginners. If you follow all of these steps, you will undoubtedly develop a good command of mathematics. As I already stated, arithmetic is extremely beneficial in all aspects of life. As a result, math is also important in Python. 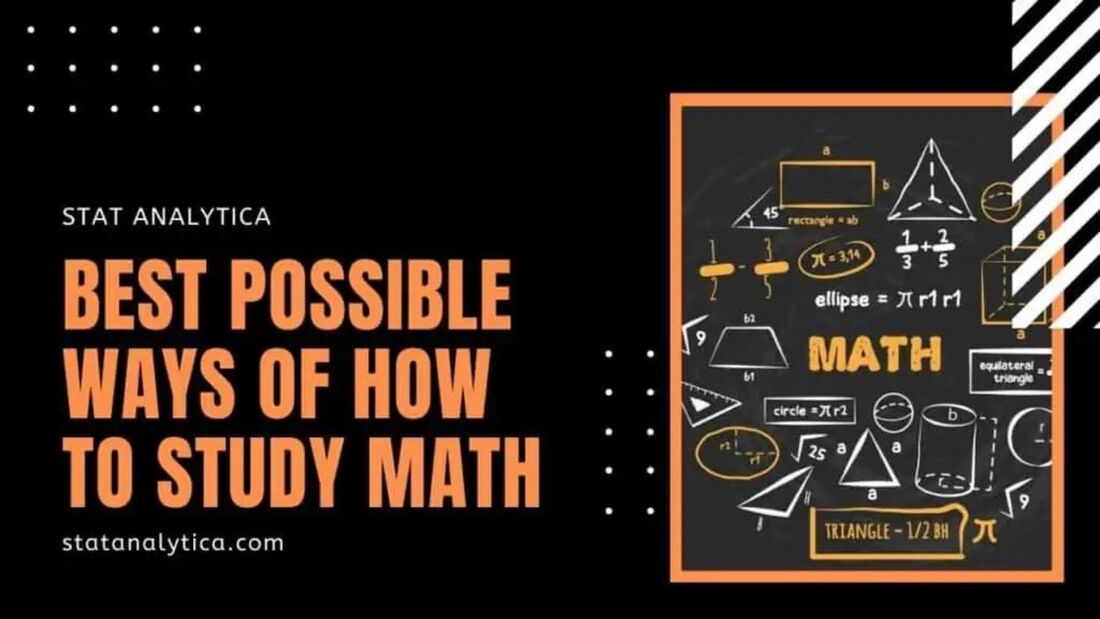 For the majority of pupils, mathematics is one of the most difficult courses. Yes, the majority of them, because there are many pupils that enjoy mathematics, and it is one of their favourites. For the most part, pupils dislike math because they have never attempted to comprehend it. They also have no idea how to learn arithmetic effectively. Or they don't solve the issues and never experience the gratification that comes with problem-solving in mathematics. Because math is a form of addiction. In this blog we mention some best possible ways of how to study math in a proper manner.
An obsession with solving arithmetic problems. The majority of students have never had this experience, which is why they dislike mathematics. Those who are already addicted to addressing problems. They've previously experienced what it's like to solve mathematical problems correctly and to know that the solution you've discovered is accurate. So it's all about the gratification of getting your solution correct, and if you don't, then trying again and again. Mathematics is a subject with a great deal of significance. It is employed in practically every scientific sector and ignores scientific skills; in fact, we can't even manage our daily lives without employing basic maths. As a result, mathematics may be found practically everywhere. If not in advanced math, then in basic math; yet, basic math is employed practically everywhere. As a result, mathematics plays a vital part in our daily lives as well as in scientific domains. That is why, if not advanced mathematics, the student must learn and study math. Then there's basic mathematics, which is the subject of our discussion today: how to study mathematics. As a result, kids must learn and study mathematics because it is very important in our society and daily life. You're probably assuming that you already understand the significance of maths. But how could we learn maths and study it so that you don't have to be concerned? Because we are here to assist you, we will provide you with various advice on how to study math in the most effective manner possible. And all you need to do is grab a pen and paper that you made to try to solve the problems in the best way possible. So that you can not only go down the steps and review them a few times, but you will also be able to complete the math problems on your own. In the most efficient manner possible, so that you can obtain the greatest possible result for the solution to your problem. The following are the steps of learning math:- You should practise as much as possible So, one of the most important things you can do for yourself while learning or studying mathematics is to always practise. As you may have heard, practise makes perfect, and this is true in every case in Mathematics 2 because anytime you learn a new formula or method of solving a problem, you are learning it for the first time. Then you apply it to your queries or problems, and what happens is that you sometimes get the correct answer, and sometimes you get the incorrect answer. Always go over your mistakes Now, as you are aware of the importance of practise in mathematics, or in any field for that matter, practise always makes a man perfect; however, as we are discussing Mathematics right now, you are aware that practising an awesome formula or a method of answering questions makes you better; however, what happens when you get things wrong? Always be aware of your uncertainties Now, if you have any doubts in your mind after making an error or doing something incorrect with your problem, as the previous step states, you should always review your errors and know what went wrong while completing the difficulties. When you leave your hair, what happens if you have any doubts that “I have followed the steps and the steps”? Please point me in the appropriate direction for the measures I need to take to get these things right.” Always make a study schedule for yourself You should always have a study planner since it will help you get the most out of your day by making a study planner who already knows what to accomplish in a specific time period and will do-follow if you want to spend the day in that specific time period. Many days, that becomes your pastime, and if studying daily becomes your hobby or is of interest to you, we are confident that you will receive the highest grade or grade possible. Formulas should be kept in a separate notebook So, as you already know, there are many phases to learning how to study math and what you should do to get the most out of your maths study session. Sudeshwar, there are certain basic elements that we should remember and that you should follow in order to achieve the best possible results when learning mathematics. But there is one more thing you should always remember, and that is to keep a notepad specifically for your mathematical formulas, approaches, or other ideas. Conclusion As a result, there are a few steps that you should always remember when learning mathematics. And that was the topic for today: how to study math. Please share this with your friends so they may learn how to study mathematics and how to get the most out of their study schedule while doing so. 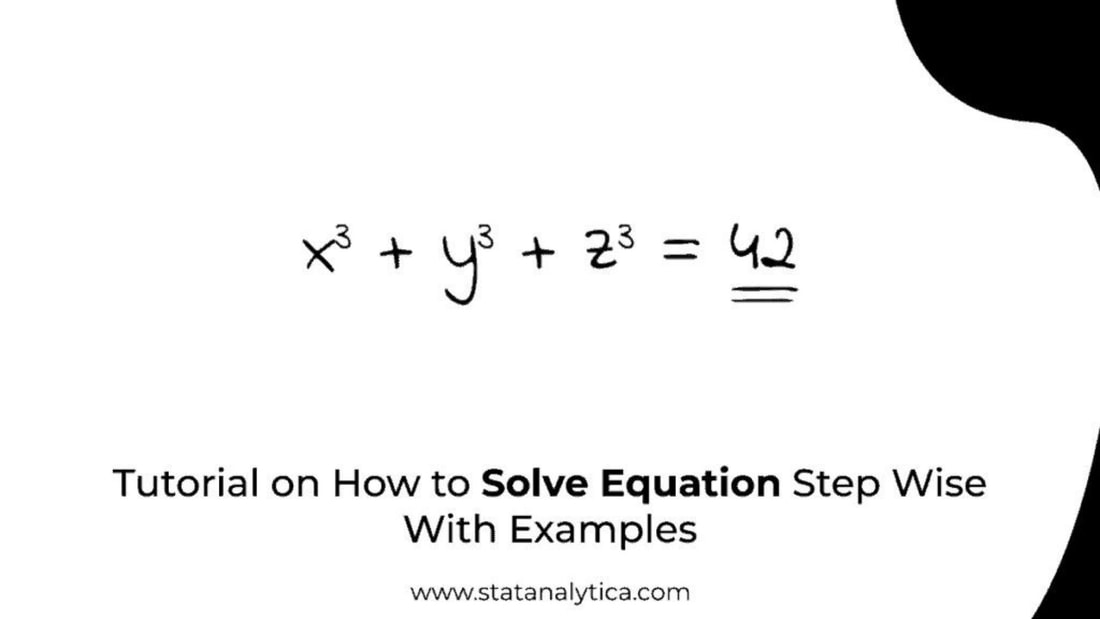 An equation is a statement in which the values of two mathematical expressions are equal. It is indicated by the equal sign ‘='. As a result, we commonly have problems solving equations and question how to solve equations. If you're having trouble with the same problem, this article will show you how to solve it.
In mathematics, there are various types of equations Linear equation These are equations of the form Y=ax+b, where a and b are numbers and x cannot be 0. Quadratic equation These equations are of the sort where one of the variables has a two-digit exponent. A quadratic equation in which x is not equal to zero is ax2+bx+c=0. Radical equation These equations have more than one term and have a maximum exponent on the variable of 12. In the square root, the variables in the radical equation are usually included within a radical symbol. Trigonometric equation These are equations in which the variables are influenced by trigonometric functions. Polynomial equation These equations are of the type where the highest exponent limit is removed. The ‘xs' in this equation are all numbers, and the equation is made up of numerous terms. Exponential equation These equations are of the type where variables are used instead of exponents. How do you tackle the problem? The procedure for solving an equation with only one variable is as follows: Step 1: To see the solutions, write a problem to solve a two-step algebraic equation. Step 2: To isolate the variable terms, you must decide whether to employ addition or subtraction. If one side of the equation is added or subtracted, the balance must be maintained on the opposite side. Step 3: Complete the process of isolating the variable term by adding or removing the constant on both sides of the equation. Step 4: A variable's coefficient must be removed by division or multiplication. Step 5: Solve the variables by dividing the left side of the equation. How do you solve a one-variable problem that has two sides? Solving an equation with one variable on both sides: Step 1: When writing a problem to solve, ensure that both variables are the same. Step 2: The constant is relocated to the right side of the equation. The constant is removed from the left side of the equations by using addition or subtraction. Step 3: Addition or subtraction are used to transfer variables to the left side of the equation. Step 4: Solve the variable by dividing both sides of the equation to isolate it. What is the best way to solve the two-step equation? However, there are various methods for solving two-step equations, such as maintaining the variable on the right side of the equation. As long as variables are isolated, the results will be the same. Two step equations can be solved by multiplying at the end rather than dividing. This type of problem is solved by combining the constants, isolating the variable term, and then isolating the variable without the term using arithmetic. How to solve the equation? Solving a linear equation: Step 1: Simplify either side of the equation if necessary. Step 2: Use addition or subtraction to transfer the variable terms to one side and all other terms to the other. Step 3: Multiply or divide any values that are in front of the variable to remove them. Step 4: The final step is to double-check the solution. The procedure for solving a quadratic equation is as follows: ax2+bx+c=0 is a quadratic equation in which x is not equal to zero. Step 1: Divide all terms by a (the x2 coefficient). Step 2: Move the number term, c/a, to the right side of the equation. Step 3: Complete the square on the left side of the equation and balance the equation by adding the same number to the right side. Step 4: The square root is taken on both sides of the equation. Step 5:To find x, subtract the number that remains on the left side of the equation. Process to solve radical equation: Step 1: On one side of the equations, isolate the variable and radical. It's done by grouping like phrases together and adding or subtracting integers until the variable and radical are left alone. Step 2: To eliminate radicals, both sides of the equation are squared. The reason for this is because the equation must remain balanced. Step 3: The answer is double-checked against the original problems to ensure that it is correct. Simply plug in each answer for ‘x' in the original equation to check an answer. Equation with multiple radical: Step 1: To get variables on their own, eliminate all of the radicals at once and solve the remaining equations. Step 2: Under the radicals, one of the variables is isolated. Step 3: Remove the radical on the left by squaring both sides of the equation. Step 4: Separate the other square root as well. Step 5: To undo radicals, both sides are squared. Step6: Using algebra skills, solve for ‘x' once all the radicals have been removed. Step 7: Check all possible solutions in order to find the correct answer. Conclusion Remember that an equation is balanced with a sign ‘=' in order to solve it. In order to keep the equation balanced, if one side of the equation does something, the other side must do the same. Simply begin by simplifying each side of the equation, then use addition or subtraction to transfer every component of the equation that contains the variable to one side, isolate the variables from the constant part, and then check the results by re-entering the original equation. The original equation must balance with the solutions if everything is done correctly. 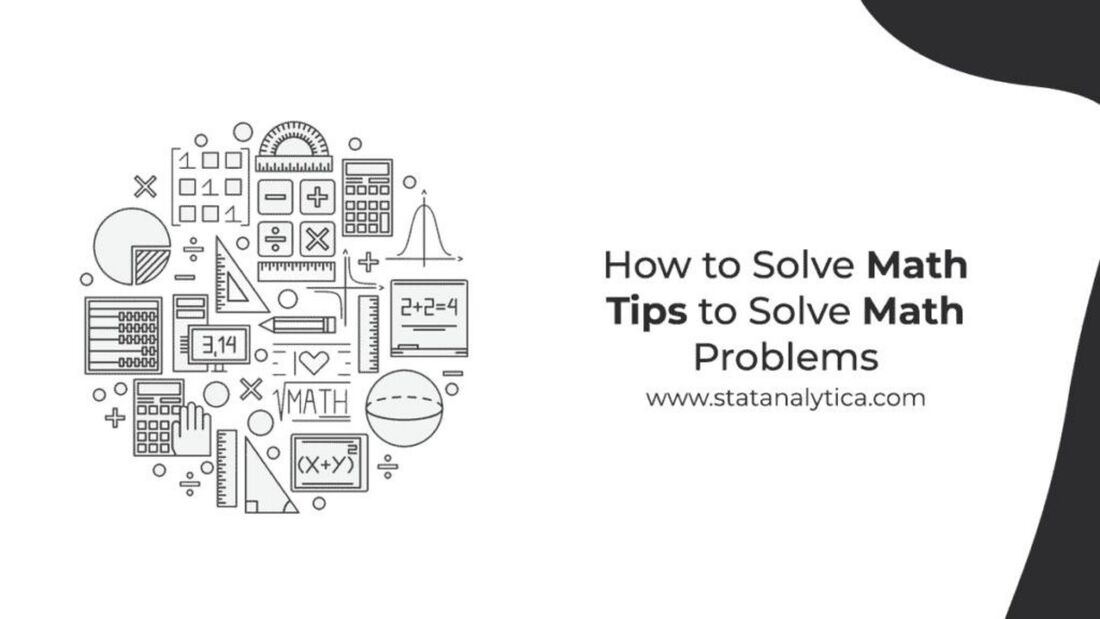 Even though math problems can be understood in a variety of ways, there is a general strategy for capturing, visualising, and then dealing with math difficulties that can help you solve even the most difficult difficulty. These approaches can also help you improve your math skills. Because it is common for pupils to be unable to solve some math problems. As a result, people believe they are unable to complete the task. But that isn't the case. All they have to do is invest some time and effort, as well as follow a few simple steps that we will outline for you. In this blog we mention the details of how to solve math problems.
Recognizing the Problem To begin, you must first comprehend the issue, which can be accomplished by following the steps outlined below: Recognize the difficulty Is it a grammatical issue? Part? Is this a quadratic condition? Before you begin answering the problem, determine which classification best fits your arithmetic problem. Setting aside the time to recognise your challenging type is critical to determining the best method to solving the problem. Carefully examine the issue Regardless of how simple the problem appears to be, you must always read it carefully. Don't dismiss the issue out of hand. If the problem is difficult to read and grasp, you may need to read it several times before you fully get it. Simply spend as much time as you need and don't go on until you're confident that you understand what the challenge is asking of you. Rephrase the issue It might help you express or work it out in your own words to help you grasp the problem you're dealing with. If you're in a situation where you can't stand the difficulty, such as during a test, you can basically express it or sort it out. Check what you've said or written against the first problem to make sure you're speaking about it correctly.
If there are any patterns, look for them You can sometimes recognise an example or examples in a math problem or any pattern by carefully reading the problem. You can also build a table to help you figure out if there is a pattern to the problem. Make a list of any examples in the problem that you recognise. Then go on to the next phase in the problem-solving process. Examine the information you've obtainedCheck your data against the problem to make sure you've accurately replicated the numbers and other information. Don't go on to the planning stage unless you're certain you have all of the relevant information and a comprehensive understanding of the situation. If you're having trouble understanding the problem, take a moment to look at some models in your reading materials or on the internet. Examining how others have successfully dealt with similar issues will undoubtedly aid your understanding of the issue. Building up a Plan Recognize the approaches that should be used to solve the problem. If the problem is really challenging, you may need several strategies and plans to address it. Spend some time researching ideas that will assist you in resolving this issue. Determine which formulae you'll need to solve the problem Make a list of the steps you'll need to take to solve the problem. This checklist will help you keep organised and focused as you begin to solve the problem. You can also use it to assess the response to a problem before explaining it fully. Start with a simpler problem If a simpler problem that is similar to the one you are trying to comprehend is available, try it first. This will give you a sense of a challenging situation. Make an educated guess on the correct response Separate the numbers and variables that must be added to answer your problem. Examine your progress to see if anything has slipped your mind. Then try to come up with a reasonable suggestion for the answer. Taking care of / resolving the issue Follow your arrangement Carry out the arrangements and plans that you made in the preceding steps. To ensure precision and acquire the appropriate solution, double-check each of your responses as you work. Compare your responses to your ratings You may need to compare your responses with the assessments you considered for each stage as a general guideline for the challenging answer as you complete each progression. Check your answers to see if you completed the assignment completely in order to get the correct answer. Try a different layout If your current arrangement isn't working for the problem you're trying to solve, you'll need to come up with a new one. Then you must adhere to that exact structure. To find a solution. Consider the problem When you've finished solving the problem correctly, take a look at the steps you took to get there. When you have a similar situation, pausing for a minute to check the problem and how you comprehended it will help you. It will also help you identify any  In case you're an understudy or an entrepreneur who needs to figure out how to maintain a business with bookkeeping programming, like Quickbooks and Excel, or a business proficient who needs to propel their profession by picking up bookkeeping programming. This blog will help you in finding out about Excel and Quickbooks, just as the Excel Vs Quickbooks. What are the primary contrasts among them, and which one is the better alternative to utilize? An understudy of bookkeeping wishes to apply bookkeeping ideas to true programming, like QuickBooks. He entered similar information into Excel to apply to this present reality idea, which permits him to tackle issues significantly more rapidly. So we should begin with some fundamental data about QuickBooks and Excel, and afterward look at Excel and QuickBooks.
Quite possibly the main parts of maintaining a business is knowing your organization's present monetary wellbeing. You could be losing cash in the event that you don't have the foggiest idea how your organization is getting along monetarily. This is the reason they have a superior comprehension of their organization's accounts. Bookkeeping programming, for example, Excel versus QuickBooks has gotten famous among organizations. However, shouldn't something be said about Excel? We should investigate QuickBooks and Excel to perceive how they vary. What is Excel, and how can it respond? Dominate is a Microsoft accounting page program that arranges numbers and information utilizing equations and capacities. It creates an advantageous sheet that is easy to understand and alter. We can utilize Excel to direct monetary investigation on organizations of all sizes everywhere. When looking at Excel and Quickbook, get what Excel is utilized for. Dominate is generally utilized in all parts of money. Dominate is charming on the grounds that it permits clients to make recipe based bookkeeping pages. They can ascertain anything from a straightforward month to month financial plan to a thorough yearly report for a company. Dominate can likewise be utilized to sort out and track normal information like prospective customers, project status reports, contact records, and invoicing. At long last, Excel can be utilized to perform logical and factual examinations on huge informational collections. Dominate factual equations and diagramming can be utilized to perform fluctuation examination and graph complex information. Quickbooks is an online bookkeeping program. Quickbooks is a web based bookkeeping program that obliges the necessities of entrepreneurs, bookkeepers, independently employed people, and business visionaries. This product simplifies it to make GST solicitations. It likewise monitors cash through internet banking and permits you to effortlessly oversee stock, staff, and finance. Having magnificent highlights for your bookkeeping and accounting needs. Quickbooks Online is an incredible bookkeeping programming that is basic and simple to utilize. QuickBooks offers an assortment of alternatives for everybody, from specialists to independent ventures. Dominate Vs Quickbooks: A Comparison. Realizing how to utilize accounting pages successfully was once viewed as a significant expertise. Bookkeeping page Media can assist you with taking care of numerical issues or conditions. The lone issue is that these Experts are the ones in particular who know about the accounting page. With the present bookkeeping programming, that is not true anymore, as anybody can figure out how to utilize QuickBooks. QuickBooks' apparatuses and reports, indeed, far beat those of its archetypes. For Small companies, Excel vs QuickBooks. Dominate is certainly advantageous to a developing business person who is as yet utilizing their ledger to accomplish business objectives. Be that as it may, when an entrepreneur requires a reasonable and current comprehension of their organization's accounts, Excel becomes unreasonable and pointless. All in all, right now is an ideal opportunity to ponder and track down a superior answer for Quickbooks or Excel for private ventures? There are a great deal of things QuickBooks can do that Excel can't. How about we investigate a couple of them.
Bookkeeping Software Comparison: Excel Vs Quickbooks Microsoft Excel isn't an accounting program. Dominate isn't a bookkeeping program, as opposed to prevalent thinking. Is it pertinent to bookkeeping? Indeed. Is it simply accounting programming? It might have been helpful before, however it offers very little in the present bookkeeping climate. In this day and age, Excel is a bookkeeping page based program, and accounting page based projects aren't the least demanding to utilize. They're outdated and could be unsafe to your organization. Minor bookkeeping page mistakes have cost organizations billions of dollars. All things considered, that is the issue with bookkeeping pages. They don't evaluate or dissect anything. They just do what you advise them to do, and in the event that you give them awful information, you'll get terrible outcomes, which can prompt enormous misfortunes. Dominate is an extremely clear program. It's ideal for monitoring your funds if your business is exclusively founded on selling things from your cellar. Be that as it may, paying little mind to how little or big your organization is, you need something substantially more impressive and devoted for a genuine business. Thus, when given the choice to pick among Excel and QuickBooks, numerous organizations pick QuickBooks. Last Thoughts To bring the Microsoft Excel vs Quickbooks discussion to a close. Dominate and Quickbooks each have their own arrangement of highlights and benefits. You should settle on your choice depending on your necessities and prerequisites. Assuming you need full oversight over your monetary information, Excel is the best approach. Assuming all you need to do is enter your monetary records essentially (or rapidly), Quickbooks is the program for you. In the event that you need to make complex diagrams and graphs, use Excel. In Quickbooks, just bookkeeping diagrams are accessible. |
AuthorWrite something about yourself. No need to be fancy, just an overview. Archives
February 2022
Categories |
 RSS Feed
