
 Do you wish to instil mathematics abilities in your children so that they might have a great future? Are you looking for children's math books? In this blog we will discuss the best books about math for students.
Do not be concerned about their age when it comes to learning math because children are naturally responsive and eager to learn new things. They want to learn about new topics in their lives, and now is the moment to pique their interest in mathematical skills. Mathematics can become their favourite subject if they understand the fundamentals of the subject. Aside from that, you should know how to pique their interest in this subject, as children prefer easy to complex learning. They enjoy reading stories, poems, and amusing activities such as cartoons. They are also enthralled by animals and legends (animal stories). As a result, parents should consider their children's interests when teaching them mathematical skills so that they can learn quickly using cartoons and stories. Furthermore, arithmetic is important in our daily lives; from our homes to our workplaces, math is required. Here, we'll go through the top 15 math books for kids that will help you pique your children's interest in the subject. The Best Math Books for Kids Absolutely one thing- Featuring Charlie and Lola By Lauren Child Lauren Child is a fantastic author who has earned numerous accolades for his contributions to book writing. Her works are classics, well-known, and well-liked all around the world. Lauren Child invented the characters Charlie and Lola. It aids in the understanding of mathematical concepts through the use of stories. The author's goal is to help children grasp the notion of math. This is a wonderful book to get for your child if you are looking for math books for kids. The author illustrates the storey extremely skillfully and practically in this book, making it easy for children to read. Marvellous Maths by Jonathan Litton Jonathan Litton, a children's book author and teacher, wrote this book. His parents are also teachers, and he has written a number of nonfiction works. His motivation for writing this book is to make arithmetic fun and accessible to kids. This book uses humorous language to teach statistics, numbers, geometry, transformations, and probability. This book's text is quite plain, so children may read it without difficulty. This may be a good fit for your child if they are in first or second grade. Provide this book to your children if you want them to become arithmetic masters. In this storey, Charlie and Lola go to the store with their mother and ask them to pick one item. Then Lola becomes perplexed and asks her mother, "Is there only one thing for both?" Charlie responds, "No, it's one thing for each," actually two things for both of us." Then Lola gets lost somewhere and counts flies, stars, and tree leaves along the way, after which she says she'd prefer two or more things, to which her mother responds, "What about "nothing"?" As she grows stronger, so does her desire to learn math, which will now be simple for them in this Imagined book. The author designed these characters because she understands how youngsters should be taught mathematical abilities. A Hundred Billion Trillion Stars by Fishman Seth Fishman Seth is the author of this book, and in it, he emphasises the fact that youngsters enjoy counting stars and want to know how many there are; they also enjoy the flashing of stars. The author of this book concentrates on attracting children's attention and forcing them to imagine when counting a large number of objects. Even adults and the mature population find reading about the sky and stars fascinating. So, if you wish to broaden your children's knowledge, this is the perfect book for them. Triangle by Mac Barnett and Jon Klassen If your children read this book, I am confident that they will appreciate it since the illustrations are amusing, and children love humorous things. This black-and-white colour book exemplifies the difference. It's a fun and unique book for kids that will help them improve their geometry skills. This book is jam-packed with amusing images of various shapes. This book is suggested for kids and parents who want to widen their views because of the amusing illustrations and imaginative visuals. The content and photos are appealing, and this is a book that parents should consider purchasing for their children. What Should a Good Book Cover? Always check that a math book for your children is entertaining before purchasing it, as children like to read intriguing material rather than tedious text. Consider the following: It should feature amusing characters and visuals, such as cartoons and superheroes.
Facts and information pique the interest of children. When they are at the learning stage, they ask a lot of questions to their parents or teachers. Books should be nicely designed. There are many books online and offline that you can give your children that will encourage them to think deeply and discover answers to their issues.
0 Comments
 Some individuals mistakenly believe that arithmetic and mathematics are the same thing. However, there is a distinction to be made between Arithmetic and Mathematics. You will learn about the differences between arithmetics vs mathematics in this article.
Arithmetic vs Mathematics In the portion of mathematics that uses a lot of operations on them, many functions are used. Subtraction, Division, Addition, and Multiplication are some of the most common operations. Addition The Addition is the process of combining two or more numbers. Alternatively, you may state that the sum of all numbers equals Adding. The numbers that are added are always the consequence of addition. Subtraction
What is the definition of mathematics? The things that are about to be learned in mathematics include logic, forms, arrangement, and quantity. Math is ingrained in our daily lives. Math is employed in everything, including daily tasks, cell phones, art, communications, banking, music, and everything else. Math is one of the best things that has ever existed, and it provides a wonderful direction for development. The demand for math varies per society, yet math is used for a lot of work nowadays. When an organisation is small, the community is small as well. When tribes first arrived, humans used simple math to count and to see the location of the sun, and they used physics to hunt. Mathematical history Most countries, including India, the United States, and others, teach the real math that we use today. The Sumerians invented counting, which is currently used in almost all of the world's daily duties. Multiply, divide, add, and subtract are some of the common operations used in Arithmetic. Sumerians transfer the numbering arrangement to Akkadians circa 300 B.C. Following that, new notions in mathematics, like calendars and astronomers, are introduced. And the most crucial thing discovered as a result of this is zero, which changes the entire number system. What is the distinction between mathematics and arithmetic? The distinction between arithmetic and mathematics will now be discussed. To begin, I'll explain that Arithmetic is a branch of mathematics, however Math is a broad subject filled with calculations and variables. As a result, you will learn a lot about the differences between arithmetic and mathematics here. Arithmetic
“Goodness, that... numbers are merely placeholders for the idea,” Pauling replied. And all he did was throw aside the fact that the numerical end was clearly off. Given that this was in the 1960s, before the widespread availability of adding machines and computers, his thesis is far more valid now. Acquaint yourself with scientific hypotheses, and the adding machines and computers will keep you precise. All things considered, it is critical to stress that adding machines have a role in our children's education, but not at the expense of their ability to comprehend the content using their own minds. Algebra and Trigonometry Both number algebra and trigonometry are unquestionably conceptual. In “Zen and the Art of Motorcycle Maintenance,” a father and his 9-year-old child are riding cross-country on a cruiser, and the father is discussing apparitions with his child as they pass through bleak wasteland terrain. At that point, his youngster inquires as to whether he, the father, believes in apparitions. “Obviously, not!” says the father, abruptly and quickly. Then he thinks about it and tells his child that he might believe in apparitions since he believes in the number system and that it is a ghost. A ghost is an intangible object that cannot be touched or felt, has no weight, and has no mass. What exactly are numbers? They are images with significance attached to them... Furthermore, for a select few, integrating the photographs with the actual inspection process is a one-of-a-kind experience. When we look at ancient Egyptian numbers, they are insignificant images to us unless we have taken the time to investigate and link the image with its intended value. After spending the majority of my life teaching secondary school arithmetic, hearing my uncle say that what I'm teaching isn't "genuine math" was disappointing — his actuality was teaching particle material science math to cutting edge graduate understudies at Stanford University. The writings he wrote were only understood by a few people on the earth. In his mind, number-crunching is organising, although math is not — verifying through analytics is number-crunching in his mind. To me, the hypothetical math in his writings was nonsense, but to him, it was a symbol of composition - the "marriage" of math and science. According to him, the math isn't "real" math until you find a good pace. Everything hinges on one's point of view. Conclusion Arithmetic and mathematics are not the same thing since arithmetic is solely about numbers, whereas mathematics also contains variables. As a result, these are the distinctions that will dispel any doubts you may have concerning the two.  According to a survey, some students regard mathematics to be a difficult subject, while others find it to be fascinating. However, as everyone knows, arithmetic plays an important role in completing many tasks in life. Mathematics plays a significant role in our lives. As a result, they learn various Applications of Math. Aside from ordinary life, arithmetic has a variety of applications that are valuable in a variety of academic topics.
It suggests that if a student struggles with arithmetic, they may suffer with other courses as well. Weighing, interpreting chemical formulas, evaluating marketing data, measuring, drawing, and calculating statistics are just a few examples of math concepts. Furthermore, pupils who do not have a fundamental understanding of mathematics may find themselves with limited job prospects. Mathematical applications in everyday life (academics) Science and Technology In the fields of astronomy, chemistry, and physics, mathematics and science are inextricably linked. Students who may not understand basic mathematics may have difficulty reading scientific graphs and charts. Students can use sophisticated maths like algebra, geometry, and calculus to answer complex chemistry issues, study about the movements of the planets in the universe, and analyse scientific findings. Aside from that, mathematics is crucial in practical disciplines such as computer science and engineering. Students must solve many equations while writing computer programmes and figuring out algorithms during their academic studies; consequently, math is required to study these courses. Literature and Writing You may be thinking about how mathematics relates to literature, but you may not realise that algebraic equations assist pupils better grasp poetry. The quantity of words in a single line, the metre of poetry used in a single line, and the effects of rhythm on readers all require mathematical computations. Aside from that, arithmetic has various applications in everyday life, such as assisting students in planning their reading assignments in literary classes. By keeping track of the average reading time and estimating how long a paragraph will take to read. As a result, the logical reasoning that students use to solve math issues helps them write in a more logical and straightforward manner. Social Studies Students must examine and review graphs and charts that provide historical knowledge or data regarding ethnic groups throughout social science topics, such as history. Students in geography class, on the other hand, must understand how the elevation of a certain field influences the population, among other things. Students can access statistical data in the social science field if they know fundamental math formulae and concepts. The Arts Students who desire to pursue a career in music, art, theatre, or dance can use their fundamental math skills to their advantage. Music has a beat that follows a complex math series; thus, math aids students in learning the rhythms of music and dance used in theatre and ballet performances. Because the study of art entails the study of geometry, students who are familiar with basic geometry formulas can readily create outstanding art aspects. To take the images, each photographer also employs mathematics to calculate the focus length, exposure duration, shutter speed, and lighting angles. Mathematical applications in everyday life (besides academics) Managing Money Because it involves calculating compound and simple interest, the abilities taught in algebra schools can be used for money management. As a result, these skills can be used to organise one's money; additionally, they can be used to select the finest bank offers. They can also choose which of the credit cards to use for their purchases. The basic notion of interest must be understood by anyone who wishes to take out a loan. The application of arithmetic in everyday life can assist in determining the best ways to invest and conserve money. Recreational sports Trigonometry and geometry can help people improve their sports skills by allowing them to see all of the different ways they can make a basket, hit a ball, or sprint around a track. The ability to keep track of sports scores is also aided by a rudimentary comprehension of the mathematical subject. Cooking Cooking is another example of how math is used in everyday life; for example, ratios and proportions are used to make the proper measurements for each recipe. If any of the recipes call for 13 of a cup of milk, a cook must calculate the value of double or half a cup. ShoppingWhile shopping, it is vital to understand the basic applications of math in everyday life. Consider the following scenario: when purchasing a new computer, it is vital to determine which retailers offer the best financing or lowest pricing. As a result, math can be useful in determining the best price for various things. These mathematical abilities are beneficial since they assist in calculating various discounts so that an item can be purchased at a reasonable price. Conclusion This blog has discussed a variety of math applications in everyday life that are based on academic research as well as those that are not related to academics. As can be seen, there are numerous applications of mathematics in everyday life. As a result, having a basic understanding of arithmetic disciplines becomes vital. So that it may be used to execute a variety of tasks with ease.  For many students, the best math books are the key to success because mathematics had its limitations until the contemporary era.
However, it has evolved into a widely diversified topic in recent years, with no end in sight. Mathematical advances are still ongoing, making significant contributions to technical disciplines. The queen of sciences is mathematics. A variety of fields have developed on the basis of mathematics. The need to classify many fields of mathematics has arisen as the use and breadth of mathematics has expanded. Each year, a large number of math books are published, but only a small percentage of them are well-received by mathematicians and students all over the world. This site will provide you with some of the top math books that will assist you in comprehending the subject's intricacy. However, before diving into the specifics of the books, familiarise yourself with the many fields of mathematics. We will give you information on the book based on the branches of mathematics. What are some of the most important branches in mathematics? Arithmetics It is the most basic and oldest field of mathematics, and it deals with the fundamental operations and number system of mathematics, such as addition, multiplication, subtraction, and division. Algebra It is a sort of arithmetic that deals with numeric quantities that are unknown. A, B, X, Y, and other alphabets make up the unknown numeric amounts. The alphabet aid in the generalisation of written rules and formulas, as well as the discovery of missing values in algebraic equations and expressions. Geometry This is the most practical and useful subject of mathematics that deals with the size, form, and qualities of figures. Lines, surfaces, points, angles, and solids make up this branch. Other branches of mathematics that deal with higher studies are also available. Trigonometry This phrase comes from the Greek words trignon (which means triangle) and metron (which means city) (means a measure). The sides and angles of triangles are the subject of this field of mathematics. Analysis It is concerned with the rate of change in several quantities. Calculus is the most fundamental type of analysis. We'll now provide you a selection of the top math books organised by branches and general conceptual books. These books will help you improve your understanding of mathematical topics and theories. One or more of the books listed below can be preferred in order to boost grades on academic tests and assignments. The following is a list of the best math books The Princeton Companion to Mathematics This is one of the best math books available, and it is a must-have for any mathematician or student. This book has defined the truth of mathematics, which is versatile and capable of making pupils understand the complexity of maths by providing all of the approaches for solving any math issues. This book's editor is also successful in keeping the book together and binding it together. This book contains a wide range of mathematical topics, each with its own specialised article to assist students in learning advanced mathematics. It is regarded as one of the best math books because it is also beneficial to non-mathematicians who wish to master the math ideas required to cope with the general approachable nature. This book will be readable for another hundred years. And it's possible that this is the best way to learn maths. Encyclopedia of Mathematics This book might be the best reference for mathematicians because it has all of the information and covers all of the disciplines of mathematics, including arithmetic, algebra, calculus, and much more. The author of this book has done an incredible job for students by providing a simple search to each topic with important material without confusing them with the concepts of each topic. One of the best aspects of this book is that it is organised in an alphabetical order from A to Z, with an outline to help you connect the dots between different themes, which is essential for comprehension. Aside from that, it includes all of the important resources and knowledge for understanding arithmetic principles. This book has over 800 entries, each of which is followed by a timeline. A Mathematical Introduction to Logic, Second Edition This book just cannot be included in a list of the top math books. Because it provides the best introduction material with logical analyses that every learner can understand. This book's author has covered all of the skillfully explained themes, including number systems, theorems, and other issues. Mathematics recommends this book to students who have a basic understanding of math logic since it makes it easier for them to practise the tasks in the book. It has several well-chosen examples and covers a broader range of topics than other books on the market. This book might be recommended to students who want to learn and understand mathematics logic. Categories for the Working Mathematician This book has covered the most important types of theories that students should be aware of. You may believe that category theories are the most difficult topics for many students, however this book has described everything in an easy-to-understand manner. With dexterity and skill, the author applied a fantastic writing technique. As a result, this book can assist graduate-level mathematics students with little prior experience in understanding the fundamental terminologies before moving on to the important theorems. Experienced graduates, on the other hand, can use it to earn a master's degree in mathematics. Classic Set Theory for Guided Independent Study This can be used as a self-study guide because it is aimed to make the set theory topic comprehensive and understandable for students who are doing self-study. This book's reader will discover that it has discussed all of the complex themes in a clear and concise manner. It includes a number practise activities as well as a number of examples based on a variety of topics. This book contains commentaries, thoughts, and recommendations that are utilised to explain each topic in order to enhance the readers' learning experiences. Rare books that students have never seen before have this quality. Conclusion This can be used as a self-study guide because it is aimed to make the set theory topic comprehensive and understandable for students who are doing self-study. This book's reader will discover that it has discussed all of the complex themes in a clear and concise manner. It includes a number practise activities as well as a number of examples based on a variety of topics. This book contains commentaries, thoughts, and recommendations that are utilised to explain each topic in order to enhance the readers' learning experiences. Rare books that students have never seen before have this quality.  Many businesses are relying on statistical tools to stay afloat. One of the most critical aspects of our lives is statistics. Many tasks are impossible to complete without the aid of statistics. In statistics, we employ a variety of tests and algorithms in our daily lives. Because of statistics, we can perform a lot of things with data. But the difficulty is that statistics is both difficult and time-consuming. Aside from that, if we don't handle data appropriately, we can have actual data facts.
In the planning and execution phases, statistics are vital. The success of the firm is determined in this phase through data analysis. It will be challenging to achieve the desired result from the data if you undertake data analysis manually. But don't panic; we've compiled a list of the best statistics software on the market to assist you in extracting the desired results from that data. This software is built specifically for statistical analysis and makes the entire statistical procedure easier for you. Let's look at some of the most popular statistics software currently in use in the business. The Top Ten Statistics Software's SPSS (IBM) The Statistical Package for the Social Sciences (SPSS) is an acronym for Statistical Package for the Social Sciences. It is one of the most extensively used statistics programs on the planet. It's used to study human behavior. Apart from that, it's used for things like descriptive statistics, parametric and nonparametric analysis, and so on. It has the capability of automatically generating scripts for analysis. It is an IBM corporate product. Entity analysis, automated modeling, and decision management are all common uses for SPSS. SPSS has a user-friendly interface that even a novice may use without any prior experience with the software. You can't find patterns or trends in structured or unstructured data with the basic package. These features are only available if you purchase the cloud version. R R is one of the most popular statistical programming languages. R is used by the majority of mid-level data analytics organizations to complete their everyday work. R is a free statistical software package based on an open-source programming language. R also comes with several toolboxes that can be used in a variety of data processing applications. R is the most popular statistical programming language in the world. For novices, it's pretty tricky, and you'll need some programming experience to get started with R. However, if you're just getting started with R programming, the online R community can assist you. You will find a large number of programmers in our community that will help you in solving all of your problems. MATLAB (The Mathworks) MATLAB is a world-renowned analytics platform and statistical programming language. Scientists and engineers utilize it to complete their daily work. It is a Mathworks creation. The toolbox is why MATLAB is so popular. Toolboxes provide a way to extend the capabilities of MATLAB. As a result, working with MATLAB is much easier than working with other statistics programming languages. You will also receive a toolkit to assist you in obtaining the answers to the research questions. It's simple to learn MATLAB because it gives you pointers when learning how to code for the first time. Microsoft Excel If you're just getting started with statistical analysis, there's no better software than Excel. It provides you with the most up-to-date solution to your statistical analysis issue. MS Excel is a simple program to learn. It includes a variety of data visualization and rudimentary statistical tools. MS Excel may also be used to create summary metrics, as well as customizable graphs and figures. Excel is used by the majority of big data firms as their essential statistics software. Excel is used by practically every company to complete daily activities. The phrase "advanced Excel" is used to describe Excel's capabilities in the realm of statistical analysis. If you don't have enough money or programming abilities, you should start your statistical analysis with Excel. SAS (Statistical Analysis Software) The acronym SAS refers to statistical analysis systems. It's one of those statistics programs that let you utilize it through a graphical user interface or write your scripts for more complex statistical analysis. It's used in linear regression and variance analysis. Aside from that, it's employed in the corporate world for complex statistical analysis. Healthcare and human behavior research, for example, are two of the most popular areas that use SAS. SAS also provides charts and graphs for data visualization at all levels, from simple to advanced. However, if you want to do more advanced statistical analysis, you'll have to concentrate on the SAS coding phase, which can be difficult. SAS has an excellent capability that allows you to cross-verify your papers against government and company compliance requirements. SAS also provides online assistance 24 hours a day, seven days a week, for high-quality services. SAS makes it simple to manage data and deploy models. Minitab Minitab is another excellent statistics program. We utilize it for data analysis at all levels, from basic to advanced. In Minitab, you may run the command using either the GUI or automated instructions. Minitab is used to analyze data by more than 90% of the world's top organizations. It's also employed in prestigious institutions and universities. Minitab works well with Microsoft Excel. Without altering the file format, you may effortlessly transfer MS Excel files into Minitab Express. Minitab makes it simple to use resampling techniques. Stata Stata is the best statistical program available. It's the greatest since it includes everything you need for data analysis, management, and visuals. For statistical analysis, most professionals choose stata to alternative statistics software. You can use either a graphical user interface (GUI) or command syntax, like with most statistics software. However, both of these methods are far more simple and reliable than other software. In Stata, you can do everything from basic tabulations to complicated multilevel models. Stata also gives you complete control over your data. As a result, you can use the statistics groups to combine, edit, and conduct some actions. With the help of sophisticated functions, you may execute operations on duration and time-series data. GNU Octave GNU Octave is a free MATLAB replacement. It's a popular tool for performing numerical calculations. It aids in the solution of both linear and nonlinear problems. We used to do numerical experiments as well. It can also be used with MATLAB. It makes use of the interpreter that runs the octave scripting language. To make plots, graphs, and charts, Octave uses OpenGL. It provides programmers with one of the best graphical user interfaces. It is a programming language with a high level of abstraction. Octave is written in the C, C++, and Forton programming languages. There are functions, calls, and a script in it. Octave is an object-oriented programming language, other than that. As a result, assuming you have a rudimentary understanding of programming, getting started with Octave is relatively simple. It is compatible with a variety of statistical languages. It features built-in libraries that may be used to do computations ranging from elementary to advanced. Eviews Views in yet another top statistics program. It was created by Quantitative Micro Software in 1994. In the sphere of academic research, it is commonly employed. Apart from that, Eviews is used by businesses, government entities, and students. Eviews is used chiefly for its extensive statistical, forecasting, and modeling capabilities. Eviews is a Windows-only application. In other words, it's a Windows-based statistics software. Eviews is simple to use if you are familiar with MS Excel. Tableau Tableau is a competitor to PowerBI and is one of the most excellent statistics tools in the world. It is often regarded as the most powerful data visualization software available. A tableau is a tool for creating reports, dashboards and analyzing large amounts of data from various sources. It's used to visualize data and provide data insights. As a result, the data will be more user-friendly, and anyone with no technical understanding will be able to grasp it. It enables us to generate stunning data visualization charts and graphs that aid in straightforwardly comprehending complex processes. Tableau is far more user-friendly than other data visualization programs. It offers a variety of packages from which you can choose the finest one for your needs. Conclusion We've seen some of the world's top statistics software. Some are compensated, while others are unrestricted. Some tasks necessitate technical knowledge, while others do not. So, what do you have to lose? Choose the best statistics software to meet all of your statistical analysis requirements. All of these statistics programs are the finest in their respective categories. You can choose either one without consulting anyone else.  One of the most important disciplines for students is statistics. In school, almost every student learned statistics. As a result, it is vital that every student be familiar with statistical terms. Knowing the fundamental terms of statistics is sufficient for the vast majority of students.
If the pupils, on the other hand, wish to pursue a profession in statistics or data science, Then they should be familiar with the fundamentals as well as the essential terms in statistics. Aside from that, they should be familiar with a variety of statistics terms. In this article, we'll go over all of the statistics concepts that you might not be familiar with. Take a look at the following terms:- Basic Statistics Terms Mean The term "mean" is used in descriptive statistics. It is the average of the data set in question. The mean may be calculated by summing all of the data set's values and then dividing the sum of the values by the number of values in the data set. For instance, suppose you have a data set of students aged 16, 18, 17, 20, 15 years old. In this situation, the mean can be calculated by adding all of the values, which is 86 years. Then you must divide it by the total number of values, which is 5. The average age is now 86/5= 17.2 years. Median The median is a term used to describe a portion of the centre tendency. The median can be obtained by organising the observations from the smallest to the most significant values in ascending order. The data set's median is the value in the middle. If the data collection has an odd number of observations, the middle value becomes the median automatically. If there are an even number of observations, the median is determined by taking the average of the middle values. Consider the following data set of students' ages: 16, 18, 17, 20, 15 years. The median age in this data collection is 17 years. Mode The mode is the value in the dataset that appears the most frequently. From the provided data set, the mode value is more likely to be sampled. For example, suppose you have a data set of ten students ranging in age from 13 to 14, 15, 16, 16, 17, 17. Set 16 is the mode on this particular occasion because it appears three times. Significance In statistics, statistical hypothesis testing is important. It's less likely to happen, resulting in the null hypothesis. P-value The P-value acts as a counter-argument to the null hypothesis. To put it another way, it's used to rule out the null hypothesis. The null hypothesis would have more evidence to reject if the p-value was lower. The P-value is most commonly stated as a decimal number. However, if you include these figures in the percentage. Then you can clearly see that these numbers, 0.0452, equal 4.52 percent. Correlation One of the most commonly used statistics words is correlation. It is, in fact, a statistical technique. Correlation is an analytical approach for demonstrating the relationship between two pairs of numbers. With the use of correlation, we can determine how closely the pairs are related to one another. Height and weight, for example, are related to one another. Taller people, for example, would have a heavier weight than shorter persons. R-value The r-value is a measure of how well something works. In statistics, the strength and direction of a linear relationship between two variables represented on a scatterplot is measured. The value of r is always in the range of 1 to -1. Make sure the r-value of your correlation is close to 1 or -1. It becomes much easier to interpret r values this way. Key terms in statistics Advanced statistics, particularly in data science and big data analytics, are commonly referred to by key terminology in statistics. Apart from that, these essential statistical words are used by business analysts and data analysts in their daily activities. Let's have a look at some of the most important statistics phrases. Let's get started:- Population The population in statistics refers to a group of items and events that are similar in nature to some queries and experiments. It might be a collection of existent objects or an indefinite collection of objects. Parameter The parameter is also known as the population parameter in statistics. The population size is what we use to calculate the probability distribution of statistics. Apart from that, we can think of it as a statistical population's numerical characteristic. In other words, it makes advantage of quantitative characteristics of the population you'll be evaluating. Descriptive statistics It's the descriptive coefficient that's used to sum up a set of data. You can represent the whole data set or only a selection of it. The measure of central tendency and the measure of variability are the two main components of descriptive statistics. Descriptive statistics include the sample mean, median, mode, standard deviation, correlation, and regression. Statistical inference It is the process of deducing the attributes of the underlying statistics distributions using data analytics. We use it to bring the data set to a close. Regression, confidence intervals, and hypothesis tests are the four primary types of statistical inference. Skew When there are more scores toward one end of the distribution than the other, the skew occurs. Aside from that, the negative skew appeared when the scores were crowded at the high end and fewer at the low end in a tail. Positive skew, on the other hand, occurs when the distribution has a tail at the upper end. Range In statistics, the range is commonly used in study. It refers to the distance between the distribution's highest and minimum values. Variance The statistical average of the dispersion of scores in the statistics distribution is known as statistics variance. It is only effective in statistics when used in conjunction with the standard deviation. Standard Deviation The standard deviation is a measurement of the amount of variation and depression in a group of numbers. The standard deviation will be minimal if the value trend is near to the set of the means. On the other hand, if the value was spread out over a larger range, the standard deviation would be significant. Data Data is a collection of observations that can be gathered from a variety of sources. The information is separated into two categories: quantitative data and qualitative data. Because quantitative data includes numeric values, it is simple to measure. It's further broken down into two categories: discrete and continuous data. Discrete data values are those for which we know the exact number, such as the number of students in a class. And continuous data is when we don't know the exact value of data, such as the language's weight. The quantitative data, on the other hand, is not present in the numerical values, i.e., a group of people's hobbies. Probability One of the most important fields of mathematics is probability. However, it is a critical phrase in statistics and is frequently used in advanced statistics. It is used to determine the likelihood of a specific event occurring. Probability is a number that ranges from 0 to 1. If the value is zero, the event is not feasible. And if the value is 1, the event is almost guaranteed to occur. Probability and probability distributions come in a variety of forms, and they're commonly employed in data science and big data analytics. Conclusion Let's wrap up this blog with some essential statistics terms. We are aware that there are many more statistics terms that may be found in a statistics lexicon, such as numerous types of statistical tests, ANOVA, MANOVA, theorems, and so on. However, we've included a list of statistics terminology that will assist you greatly in both your statistics education and your career.  One of the most difficult subjects is statistics. The majority of kids have difficulty comprehending it. This blog will teach you all you need to know about statistical analysis, as well as the various forms of statistical analysis. And there are a lot of students who have trouble doing their statistics homework. Don't worry, we're here to assist you with your statistics. In this blog will be discussed about What is statistical analysis?
What is the definition of statistical analysis? Statistical analysis is a technique for obtaining, exploring, and representing large amounts of data in order to look for trends and patterns. Statistics are employed in everyday life, such as in industries, research, and government. It's also used to carry out scientific study and then assess the results of that investigation. Consider the following examples:
What Different Types of Statistical Analysis Are There? There are numerous types of statistical analysis, as listed below: Descriptive Type of Statistical Analysis As the name implies, descriptive statistical analysis helps to describe the data. It obtains a data summary so that information that is meaningful can be interpreted from it. We don’t come to a conclusion using descriptive analysis, but we do learn what’s in the data, i.e., the quantitative description of the data, which we know with the help of it. If we try to characterise a large number of observations with a single value, we risk distorting the original data or missing critical information. The strength of a student's subject will not be determined by his or her average. It won't tell you the student's specialisation or which subjects they found easy or challenging. Despite these disadvantages, descriptive statistics can provide a powerful description for comparing different units. There are two types of statistics used to describe data: descriptive statistics and descriptive statistics.
Prescriptive Analysis “How should we proceed?” Prescriptive analysis works on the data by asking this question. A typical field of business analysis is determining the best potential course of action in a given situation. Its entire goal is to provide direction in order to determine the greatest recommendation for a decision-making process. It has to do with descriptive and predictive analysis. Descriptive analysis analyses the data, or what has happened so far, whereas predictive analytics predicts what will happen in the future. Prescriptive analysis chooses the optimal option from a set of possibilities. Some of the approaches utilised in prescriptive analytics include simulation, business law, complex event modelling, graph analysis, algorithms, and machine learning. Inferential Statistics The population is a collection of data that contains the information we want. Inferential statistics are used to establish population generalisations based on sampling. When a sample of the entire population is taken. It's critical that the polls truly reflect the population and aren't skewed. The process of gathering various types of samples is known as sampling. The phrase "inferential statistics" alludes to the reality that sampling is inevitably flawed and cannot be assumed to completely represent the population. For generalising data, there are two types of inferential statistics methods:
Causal Analysis Everyone wants to know why the question is asked in the first place. Why is it that certain things are happening in a certain way? As a result, casual examination aids in understanding WHY things happen the way they do. The business world is full of unknowns. It encompasses both success and failure. Causal analysis identifies the underlying causes of events. This method is widely used in the IT industry. It enables them to gain knowledge of the software's quality assurance. Mechanistic analysis Mechanistic analysis is significant in major enterprises, despite the fact that it is not a normal statistical analysis technique. It is worth discussing. It's used to figure out how one variable's modifications affect the other variables. It is predicated on the idea that the interaction of a system's internal components has an impact on the system as a whole. External factors are not taken into account. It's useful in a system with clearly defined terminology, such as biology. Exploratory data analysis Data scientists mostly employ this type of inferential statistics. It's a type of data analysis that focuses on identifying patterns and figuring out undiscovered correlations. Missing data is identified, undiscovered relationships are discovered, and hypotheses and assumptions are developed via exploratory data analysis. It should not be utilised alone because it just provides a bird's-eye view of the data and some insight into it. It's the initial step in data analysis, and it should be finished before using any additional formal statistical procedures. Conclusion Statistics is one of the most difficult yet interesting subjects. Many students get puzzled while doing statistics. However, without statistics data analysis would only be a dream. As we all know today is the era of data. And data leads us to statistics i.e. study of data (basically). In this blog we have discussed what is statistical analysis and what its different types are. We hope this blog was knowledgeable for you.  You've probably observed that many individuals use the terms data and information interchangeably. However, there is a distinction to be made difference between data and information. How? Consider the following scenario:
“A healthy body's blood pressure ranges between 120/80 mmHg, according to a medical report.” – assertion 1 “On the 15th of April, 2021, Enna's blood pressure was 120/80.” – 2nd assertion Aside from that, I've included appropriate examples to help you comprehend the difference. So, dive into the details of data and information. Data Data is a disorganised and unstructured truth that must be organised in a meaningful way. It can be straightforward if it is better arranged. Furthermore, the data can be meaningfully interpreted by a machine or a human. Information It is a collection of well-organized data that is maintained in accordance with the needs. To make information useful and relevant, it is structured, processed, or presented in a certain context. Information, on the other hand, is data that has been processed and has relevance, context, and purpose. Manipulation of raw data is also part of information. Let's have a look at some data and information examples Example of Data
Data Parameters Etymology The word "data" is derived from the Latin word datum, which means "to give." With the passage of time, “data” became the plural form of datum. Description Data is a collection of quantitative and qualitative variables that aid in the development of conclusions and ideas. Format Letters, numbers, or a string of characters are examples of data. Meaning Data does not have a specific objective in mind. Representation Data can be in the form of a data tree, a tabular form, a structured form, a graph, and so on. Feature The data is unprocessed and in a single file. It has no meaning unless it is well-structured. Interrelation The information gathered is referred to as data. Measuring unit Bytes and bits are the units of measurement. Dependence It is independent of information. Contains Raw parameter that hasn't been processed. Support for Decision making It doesn't help you make decisions. Characteristic Data is considered an organization's property and is not available to the general public. Knowledge level Data is a type of knowledge that is at a very basic level. Significance Data on its own is meaningless. Usefulness The information obtained by the researcher may or may not be useful. Information Parameters Etymology The term "information" comes from Middle English and Old French. The definition of information is the “act of informing.” It is widely used in the fields of education and communication. Description Information is a collection of data that gives context and news. Format Inferences and concepts can be derived from data. Meaning It communicates the meaning that is determined through analysing data. Representation Based on the facts presented, information can take the form of ideas, language, and concepts. Feature The term "information" refers to a collection of data and a product that has been integrated to create a logical meaning. Interrelation Data that can be manipulated. Measuring unit It is quantified in meaningful units like amount, time, and so on. Dependence It is dependent on the data. Contains It has been thoughtfully prepared. Support for Decision making It aids decision-making in general. Characteristic The public has access to information. Knowledge level The second degree of knowledge is referred to as information. Significance Information is valuable in and of itself. Usefulness Information is relevant and useful since it is immediately available for application by the researcher. Distinct fields have different definitions of data and information In terms of technology In terms of computers, data is considered input. It's also used to tell the computer what to do and where to keep data. The output of data is information. It is used to instruct the computer on how to process data and which method is the most efficient. In terms of Business In business, data is considered as raw numbers. Information is made up of a variety of different data types and points. It's used to figure out what's going on with the measurements. Conclusion It is always vital to be aware of the distinction between data and information. Otherwise, the audience may not understand your point of view. Furthermore, be aware of the distinctions, as statistics regard both data and information as data only.  Have you ever considered which branch of mathematics is most commonly used? Well, statistics and calculus are the obvious answers to this question. So, which is more important to learn: statistics vs calculus?
Yes, please do!! The reason for this is that both have a variety of real-world applications. From your cell phone, car, and television to the economy, national defence, and medical, calculus concepts are everywhere. Furthermore, statistics ideas can be applied to analyses, observations, and mathematical forecasting models. What is the definition of statistics? A statistical analysis is a type of statistical analysis. It can be about anything, even business. That is why we say statistics is a type of statistical analysis that can be applied to everything. With the use of statistics or statistical analysis, we may check the growth of something, or watch the growth or possibly decline of any business. What is the definition of calculus? The first thing you should know about calculus is that it is also known as infinitesimal calculus. Or the infinitesimal calculus. And it is used to research continuous changes that can occur in any mathematical situation, just as geometry is used to study shape and calculus is used to investigate continuous changes. Statistics vs Calculus Let's have a look at Calculus Analytics is a type of arithmetic that is considered “legitimate.” It's beautiful and faultless, and you always come up with the best solutions. You are not required to write sentences. Ever! You won't have to deal with "word issues" because most of the problems are imaginary. Calculus is a popular subject among educators, and they compete for the opportunity to teach it. They are confident in what they are doing. They've been doing it for a while and don't need to do anything fresh. To help understudies, there are a plethora of web records, games, and components. The Khan Institute's recordings are priceless. However, you don't have to do your analytics on a PC. Guardians are more likely to be familiar with metrics (which are often missed) than insights. It's time to take a look at some statistics and have a discussion about them So, as we all know, the Estimates relate to life; it's perplexing, and the appropriate responses aren't always obvious, so understanding and acceptance are essential. You should write reports and distribute them on paper. This will assist you in honing your fundamental thinking abilities as well as your social abilities. You must be able to comprehend substantial material, such as science, financial concerns, or gaming. New Zealand is setting the standard for the rest of the globe by making resampling, randomization, bootstrapping, and time plan assessment optional in schools. There are extremely few online resources. Those that have survived (and are in the pipeline) are focused on your use. Even though watchmen aren't used to making estimates, you'll find what you're doing fascinating. You have the opportunity to conduct a large portion of your work on a computer, similar to how real examiners do it. “For what reason do we need to get familiar with this?” you will never ask. Since it is obvious that it is a part of your life You'll be better equipped to discern the truth from the lies on the internet. You'll find yourself looking at the world in a new way. Certain subjects, such as cerebrum science, science, planning, the board, advancement, medicine, humanism, guiding, geology, topography, legislation, and news inclusion, demand bits of information. It also broadens the expected outcomes in examinations of articulation disciplines such as History and English. Is it better to start with calculus or with statistics? Statistics aid in the development of higher-order cognitive skills. Furthermore, it is prevalent in all facets of life and aids in the successful understanding of the calculus problem. As a result, it is always preferable to start with statistics. If statistics is too challenging for you, opt for calculus instead. Now the question is, which is easier: calculus or statistics? Well, it differs from one person to the next. Some students struggle with statistics, while others struggle with calculus. As a result, it varies from person to person. However, if you practise regularly, you may easily improve and expand your skills. As a result, practise on a regular basis. Conclusion So that was everything for today's topic, which was Statistics vs Calculus. We hope you've gained some insight into our topic, Statistics vs Calculus, from the information presented above. And we hope you like it; if so, please share it with your friends and colleagues so they can learn about the contrasts and similarities between Statistics and Calculus as well. 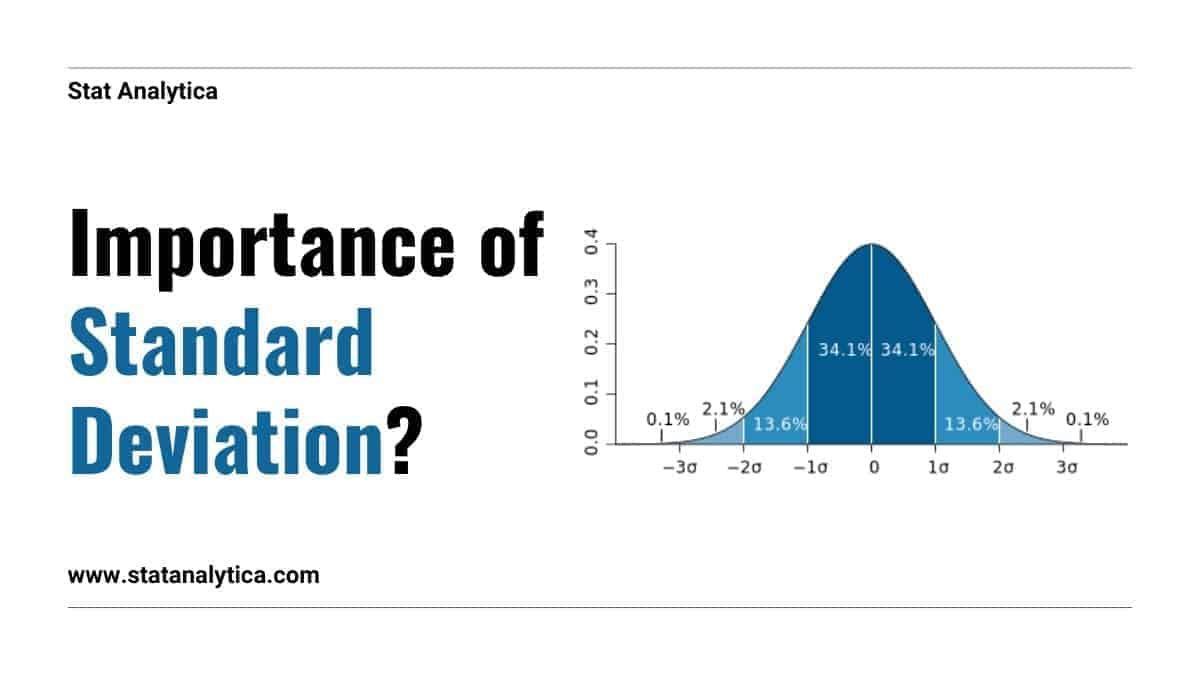 You've probably heard about coronavirus vaccination in the news recently. And there are a lot of people who are considering how an agency or medical body claims that this vaccination is effective in treating this infection. This is due to the value of the Standard deviation. Furthermore, this is the proper spot to assess the significance of standard deviation. In this blog we can discuss the importance of standard deviation.
The number of samples of a virus are evaluated with the specific antiviral vaccination during antiviral drug testing. The experiment is also tracked throughout a set period of time. The standard deviation is important since it is used to compute the viral eradication rate's mean. The SD value is useful in demonstrating that the antiviral has a similar impact throughout the sample populations. What is the standard deviation? It is used to calculate the response time variance around the mean. Or, to put it another way, the smaller the value of SD, the more rational or consistent the response time. Is there a drawback to adopting the standard deviation? Yes, indeed!!! But not nearly as much as you might assume.
What role does standard deviation play in diverse fields? In Finance Business managers utilise the standard deviation in finance to better understand risk management and make better business decisions. It aids in computing the margins of error that appear in a company's or organization's survey reports. Quality Control To maintain standards, quality management in manufacturing and production is critical. It is used to compare the output sample to a specific standard. The samples are discarded if the SD is higher than predicted since they do not fit the standard sets. Standard deviation is used by various soft drink businesses to check the sugar level of their products. Polling Polls are used to predict who will win an election. When calculating the margin of error, the standard deviation might be useful. These are helpful in determining the poll's outcome. In Business Everyone knows that there is usually some sort of disagreement between a firm and its employees. These disagreements are over pay packages, and they are unjust to some employees. The employee can compare their compensation to the average salary and standard deviation of the other employees at the organisation. If the SD is higher than intended, the owner should investigate the situation. In daily life The majority of people are unaware that they employ Standard deviation in their daily lives. There are several examples that demonstrate how we apply SD concepts without even realising it. Conclusion Some of the most significant things that a corporation must consider are quality testing and considerations. The standard deviation can be used to calculate this. I've already emphasised the significance of standard deviation in a variety of professions. You can easily apply the SD notion once you understand where it applies. If you have any questions concerning SD. |
AuthorWrite something about yourself. No need to be fancy, just an overview. Archives
February 2022
Categories |
 RSS Feed
